
COMMERCIAL STRATEGY

Refining an offer and its channels using verifiable market signals
Illustrative project
Illustrative scenario. The data and calculations are assumptions used to explain the application.
Application: Commercial Strategy
Business type: Modular furniture business serving small offices
Context and decision
The furniture business designs modular furniture for small offices. It sells directly through its website and through distributors. The catalog offers many configurations, but the team does not know whether inquiries stall because of price, difficulty choosing, lead times, or installation. Distributors are asking for discounts, while marketing proposes increasing advertising spend.
Management needs to decide which offer to test and in which channel before increasing the budget. One option would be a simple package with scheduled delivery. Another would retain customization and improve the guidance offered to buyers. Answering the question requires connecting what people inquire about with what they ultimately buy, without assuming that greater digital interest means greater profitable demand.
Required sources and limitations
The project would require orders and returns by product and channel, discounts, delivery and installation costs, quotes, availability, and documented reasons for abandonment. Website analytics, where configured with the appropriate permissions, would provide aggregated events. Each event's meaning would be reviewed: a visit, an inquiry, and an order are different units of measurement.
External research could examine offers, prices, publicly listed availability, delivery terms, and reviews of comparable alternatives. The observation date, variant, and terms would be retained. A price comparison would be valid only if it distinguished materials, dimensions, taxes, assembly, warranty, and shipping. Temporary promotions and unconfirmed prices would carry their own labels.
Licenses, terms, and reproduction rights would be checked before collecting or displaying platform data. Reviews would help identify themes and formulate questions, rather than estimate sales, visit frequency, or how representative they are of all buyers. Individuals would not be profiled, and sensitive attributes would not be inferred. Interviews and customer data would use only authorized, necessary information.
Proposed solution
STRTGY could structure an analysis of offers and channels that connects each point of friction with its evidence and a possible test. The solution would bring together competitive comparisons, channel economics, and customer experience themes. It would separate observed problems from explanations that have not yet been verified.
The recommendation would go beyond simply lowering prices. The team could compare a defined package, clearer information, or an additional service, checking margin and capacity. Each alternative would specify a business audience, a need, an operational requirement, and a success criterion. The final proposal, sales messages, and any price change would require approval from the responsible owners.
Workflow
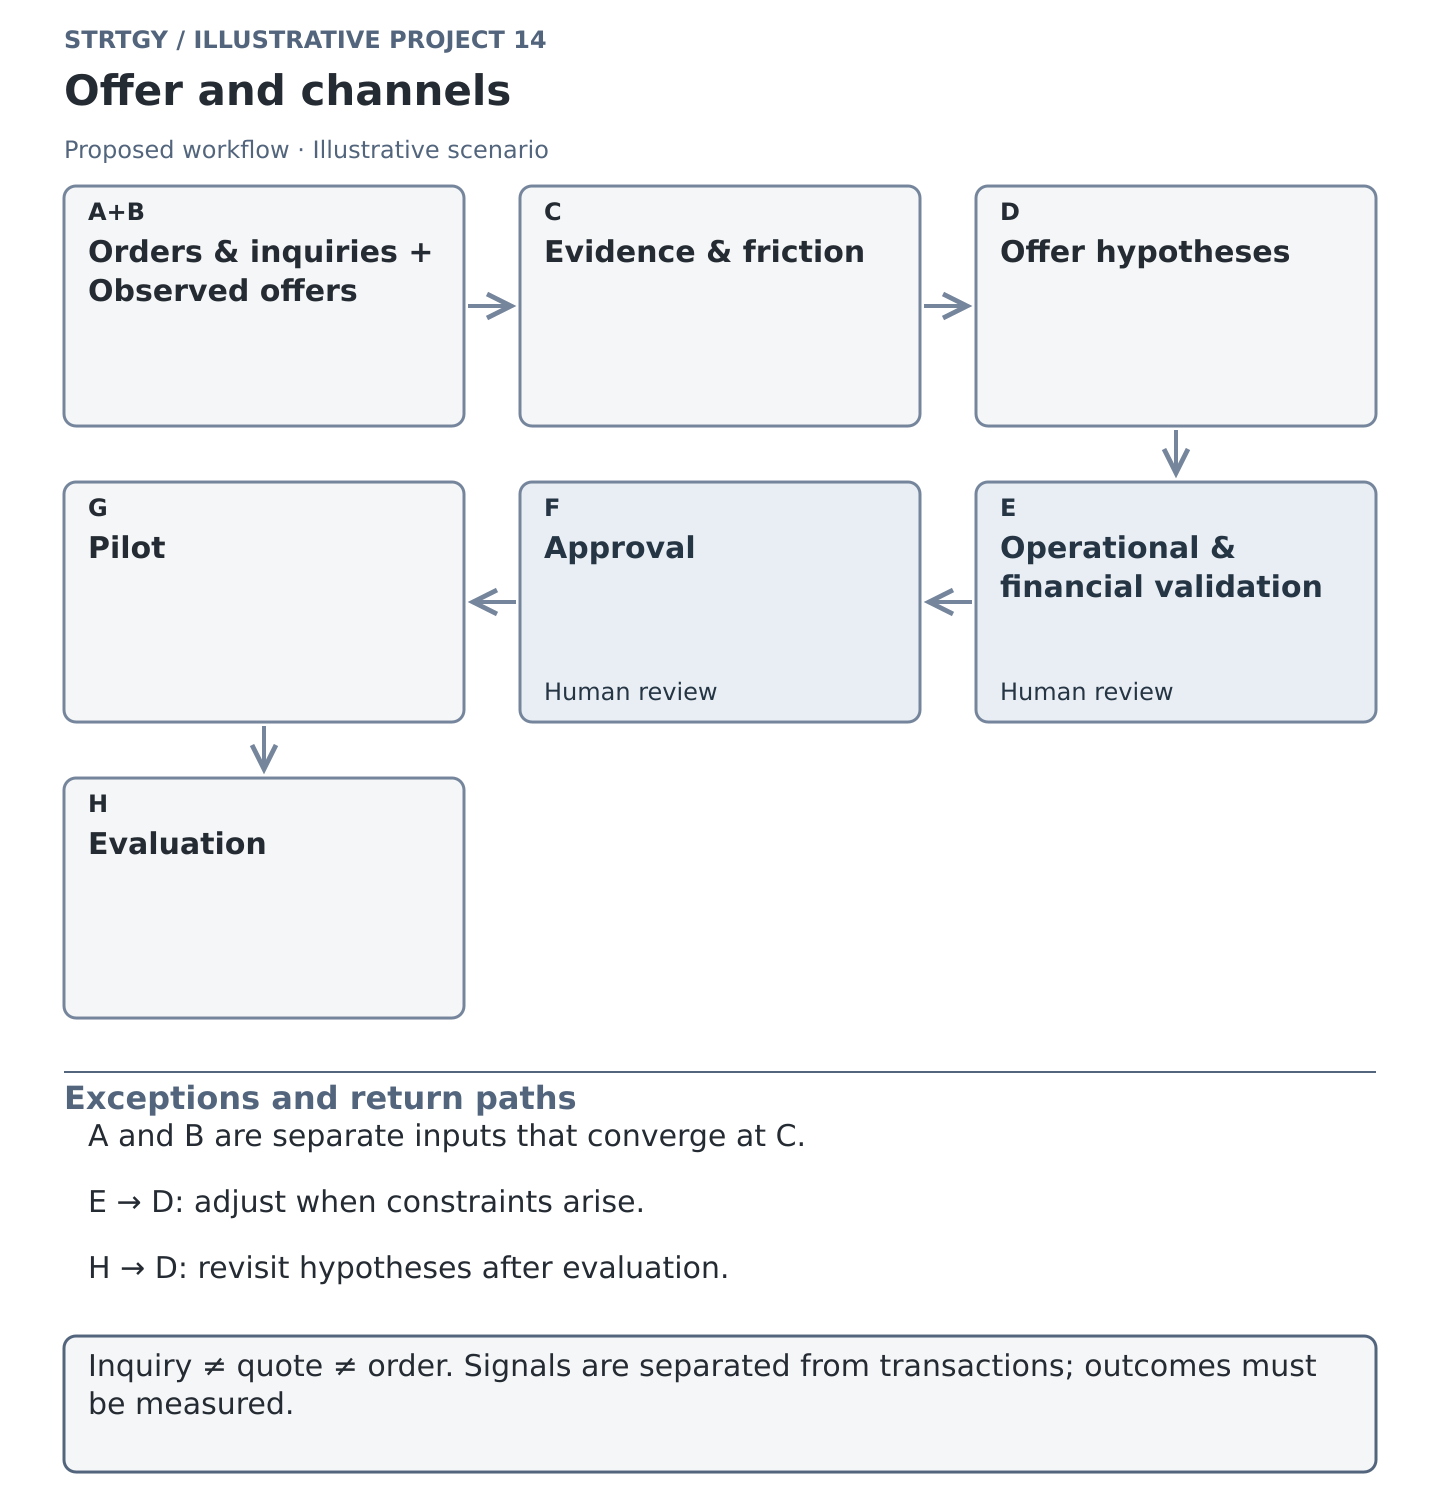
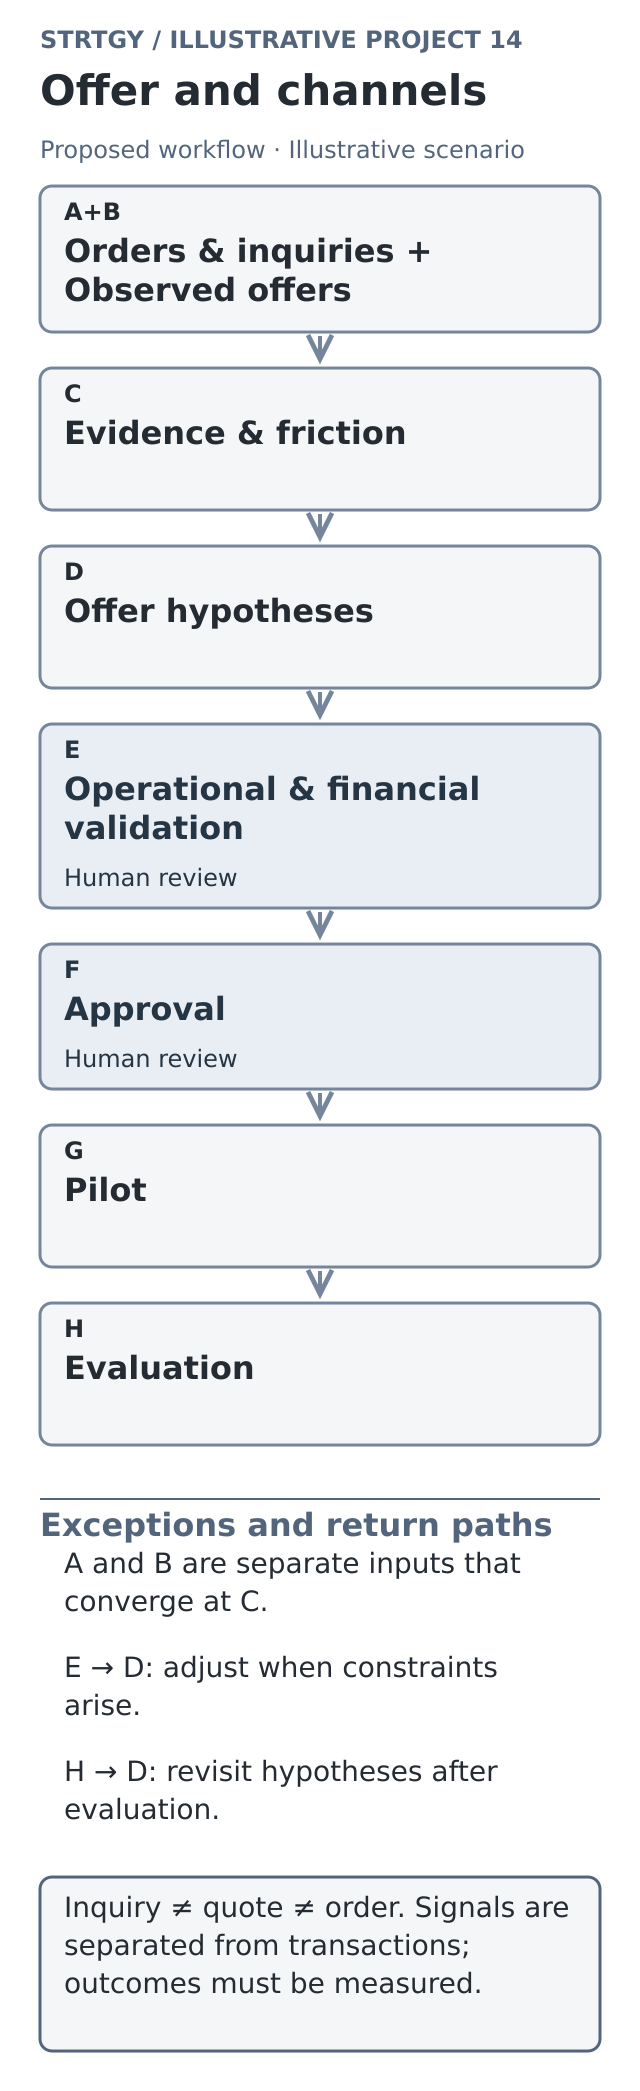
Sales leadership defines the products, channels, budget to be evaluated, and outstanding decision.
The data team reconciles orders, quotes, and analytics. Events without reliable definitions are excluded from the quantitative assessment.
Research organizes comparable offers and review themes, retaining sources and limitations.
Sales validates hypotheses through inquiries and interviews. An explanation without evidence remains a question.
Operations and finance review each proposal's availability, delivery, installation, and contribution.
Management approves a pilot and its materials. Unapproved changes to prices or terms block the launch.
The responsible owners run the test, record incidents, and stop offers that cannot be fulfilled.
The team compares cohorts and decides whether to retain, modify, or withdraw the proposal.
User experience and deliverables
The user would see an alternatives matrix and a profile for each hypothesis. One example might be: “Choosing a configuration makes it harder to request a quote,” accompanied by the inquiries supporting it, the limits of the evidence, and a test using a simplified catalog. A dashboard would show the journey from inquiry to order without concealing differences in attribution between channels.
Deliverables would include competitive analysis, a friction map, channel economics, hypothesis profiles, and a measurement plan. Phases would cover diagnosis, focused research, offer design, and the pilot. The handover would explain who updates observed prices, who validates changes, and when a conclusion is no longer current.

Illustrative modular-offer review: comparing assembly and finishes helps assess options the operation could deliver and install before approving a sales test.
How it would be evaluated
A baseline would be established using comparable cohorts and completed buying cycles. Metrics: quote conversion (%) = eligible quotes generating at least one order / eligible quotes × 100, with both counts drawn from the same cohort and completed buying cycles; contribution margin (%) = contribution / net revenue × 100; returns (%) = returned orders / delivered orders × 100; fulfillment (%) = orders delivered in full within the deadline / delivered orders × 100. Denominators and sample sizes would be reported. Changes in the sales mix, seasonality, or inventory shortages would limit causal attribution.
Hypothetical example: a pilot costs MXN 30,000 and generates MXN 3,000 in contribution per incremental order after discounts, delivery, and installation. Ten incremental orders would cover that cost. If the new package displaces existing orders with a higher contribution, that loss must be deducted before claiming the pilot has paid for itself. The example does not assume those orders will occur or that the channel can scale.
What do you need to understand before changing your offer or investing more in a channel? Let's talk about your market.