
MANAGEMENT AND FINANCE

Understanding why sales are growing while margins fall
Illustrative project
Illustrative scenario. The data and calculations are assumptions used to explain the application.
Application: Management and finance
Business type: Business maintenance supplies distributor with several branches
Key decision: Which customers, products, and commercial terms need closer review to explain a change in margin.
The context and the question
The distributor supplies maintenance materials to businesses through several branches. Leadership receives a sales report, Finance calculates margins from the business management system, and Sales analyzes discounts in spreadsheets. When sales rise and margins fall, each team offers a different explanation. A shift in the product mix can be confused with a cost increase, a late return, or an exceptional commercial arrangement.
The team needs an evidence-based review: quantify the contribution of each factor, find the relevant transactions, and decide what warrants investigation. Changing a price or renegotiating with a customer requires context that an aggregate figure cannot provide.
Information needed and boundaries
The project would use invoice line items, credit notes, recorded costs, product and customer master data, branch records, and approved commercial terms. Finance would define gross margin and specify which expenses are excluded. It would also approve the cutoff date, the treatment of returns, and the comparison of equivalent periods.
Initial access would be read-only, through controlled exports or integrations whose feasibility would need to be validated. Branch managers would see only their own area; Finance would retain access across branches. Sensitive costs and commercial terms would not be available to every user. A transaction without a reliable cost would be marked as pending, rather than silently replacing the missing value with an estimate.
The proposed solution
STRTGY could build an analytical view that connects the overall result to its components. The solution would separate changes in volume, mix, price, and cost using an agreed method, documenting how it handles interactions between factors. This breakdown would provide an accounting explanation of the change. An operational cause, such as a negotiation or an urgent purchase, would require further validation.
The scope would include comparisons, flags for review, and access to supporting evidence. Financial calculations would follow verifiable rules. If AI were included to draft a summary, it would have to rely on those results and identify what still needs to be checked. The tool would not change prices, contracts, accounting entries, or credit terms.
How a review would work
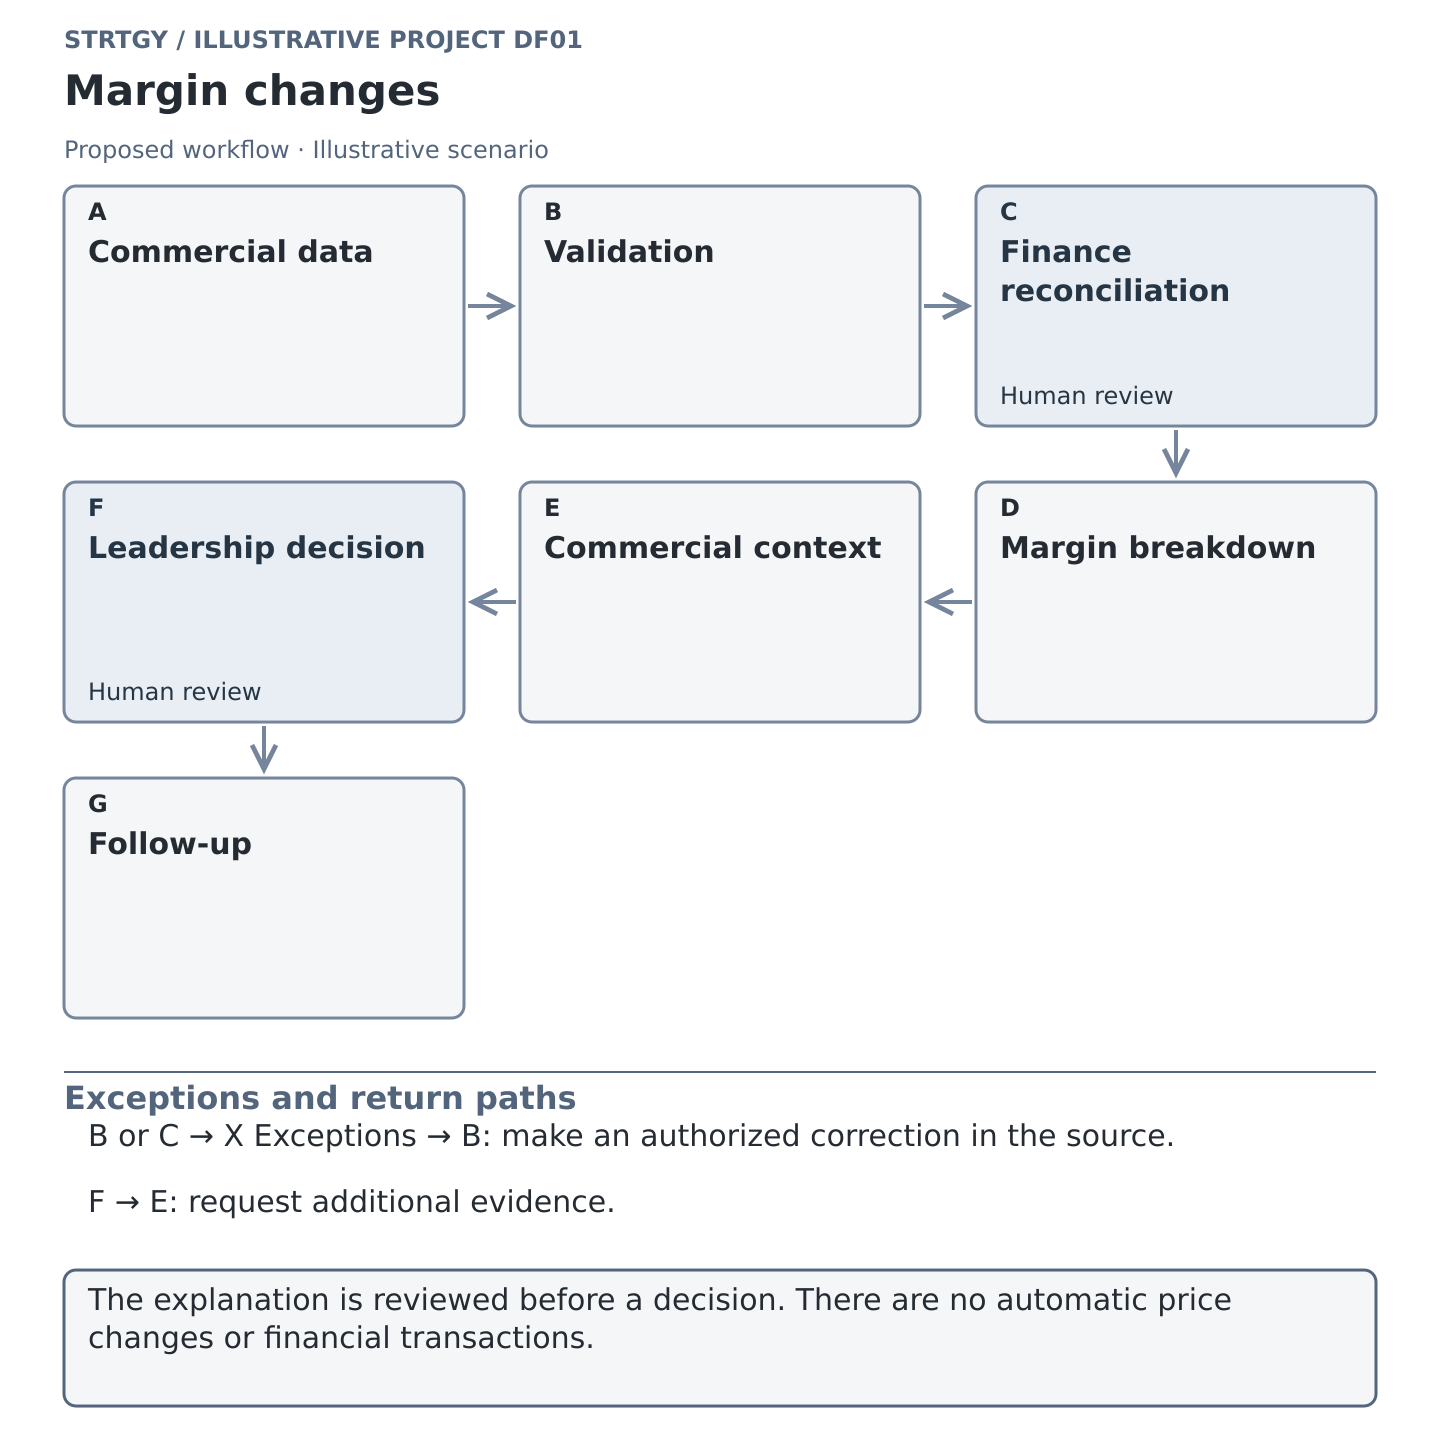
Finance sets the cutoff. It selects comparable periods and confirms which transactions belong in the analysis.
The workflow brings the data together. It retains source identifiers and detects missing data, duplicates, and inconsistencies in master data.
Accounting reconciles the figures. It checks sales, costs, and credit notes against control totals. Discrepancies remain open and prevent release of a validated view.
The solution breaks down the change. It presents the factors using the approved method and allows users to drill down to individual transactions.
Sales adds context. It documents promotions, mix changes, and relevant agreements. If evidence is missing, the explanation remains a hypothesis.
Leadership sets priorities. It selects cases that justify a commercial or operational review and assigns owners.
The owner follows up. They record the decision and its status. Any change with financial implications follows the existing authorization process.
What the team would see
The opening screen would show sales, costs, and margins alongside the period, last update, and reconciliation status. A variance chart would show which components account for the change. Selecting a product family would reveal related customers, transactions, and notes. One column would distinguish verified observations from explanations awaiting validation; another would show the owner and next review.

Illustrative image. Finance and Sales compare evidence and context before turning a margin explanation into a decision.
Deliverables and implementation
The team would receive a metric dictionary, reconciliation rules, a data model, an analytical view, and a decision log. Documentation would specify permissions, exception handling, and maintenance responsibilities. A representative sample would be validated first, followed by testing across complete periods. With Finance's acceptance, the view would then become part of the review cycle. Expansion to other branches would depend on source quality and the agreed scope, with no guaranteed dates.
How to evaluate its usefulness
A baseline would be established before the pilot, using comparable cycles and including the time required for human review.
Analysis preparation: total hours spent extracting, reconciling, and preparing the analysis per cycle.
Consistency: absolute difference between the analytical total and the control total, in pesos, for each metric.
Traceable data coverage: transactions with complete, traceable data / transactions included × 100.
Follow-through: reviews with an assigned owner and a recorded decision / prioritized reviews × 100.
Hypothetical economic example
Assume eight monthly reviews that each take six hours. If a pilot demonstrated that they could be prepared in three hours, the capacity freed up would be 8 × (6 − 3) = 24 hours per month. At an assumed internal cost of MXN 450 per hour, that would be equivalent to MXN 10,800 in work capacity. It would not be an automatic cash saving or a guaranteed improvement in margin. The evaluation would need to deduct operating, maintenance, and additional review costs, while considering the initial investment separately.
Can your team explain margins in the same detail it uses to review sales? Let's discuss your data sources and decisions.
Let’s discuss your process
Data & Decision Intelligence · Explore applications · Discuss your project