
EXPANSION & LOCATIONS

Choosing a new location using market and operational evidence
Illustrative project
Illustrative scenario. The data and calculations are assumptions used to explain the application.
Application: Expansion & Locations
Business type: Café operator serving light meals
Context and decision
The business operates cafés serving light meals and is considering a new location. The team has three candidate properties, a limited investment budget, and the capacity to oversee only one opening. One property offers high visibility, another has lower rent, and the third appears to complement the company's existing coverage. Management needs to decide which option warrants more detailed on-site and financial validation, or whether to postpone expansion.
The current comparison combines photographs, the property broker's opinions, and sales reports from existing locations in different formats. A busy area may look attractive even when its activity patterns, accessibility, and observed purchasing behavior do not match the brand's offer. Opening near an existing location may also shift sales between branches without generating equivalent growth.
Required information and limitations
The project would require sales by location, time of day, and category; transaction counts and margins; labor costs; kitchen capacity; and property rents and terms. Finance would validate which costs are comparable and which depend on the operating format. Customer addresses, if needed and authorized, would be aggregated into sufficiently broad areas. The analysis does not require identifying individuals or inferring sensitive characteristics.
External sources could include business directories, local statistical data, licensed mapping data, public prices, and field research. Each source would carry a date, coverage details, unit of measurement, provenance, and terms of use. Information being visible online does not mean it can be freely extracted or redistributed. Licenses and permissions would be checked before it was incorporated.
Pedestrian counts, where available, describe foot traffic during a specific observation window. They do not equate to customers or sales. Reviews help identify customer experience themes, but the number of reviews does not measure visits. Comparing areas would require equivalent times of day and seasons, with missing data and selection bias made explicit.
Proposed solution
STRTGY could build a location comparison tool that connects market conditions, operational constraints, and financial scenarios. The first step would be to apply disqualifying criteria: permitted use, minimum floor area, supply access, and the investment limit. Viable alternatives would then be compared using agreed criteria and sensitivity analysis. Changes in the ranking caused by missing evidence or revised criterion weights would be clearly visible.
The tool would show why an option merits further investigation, without treating a score as a guarantee of success. The decision to sign a lease and commit capital would remain with management.
Workflow
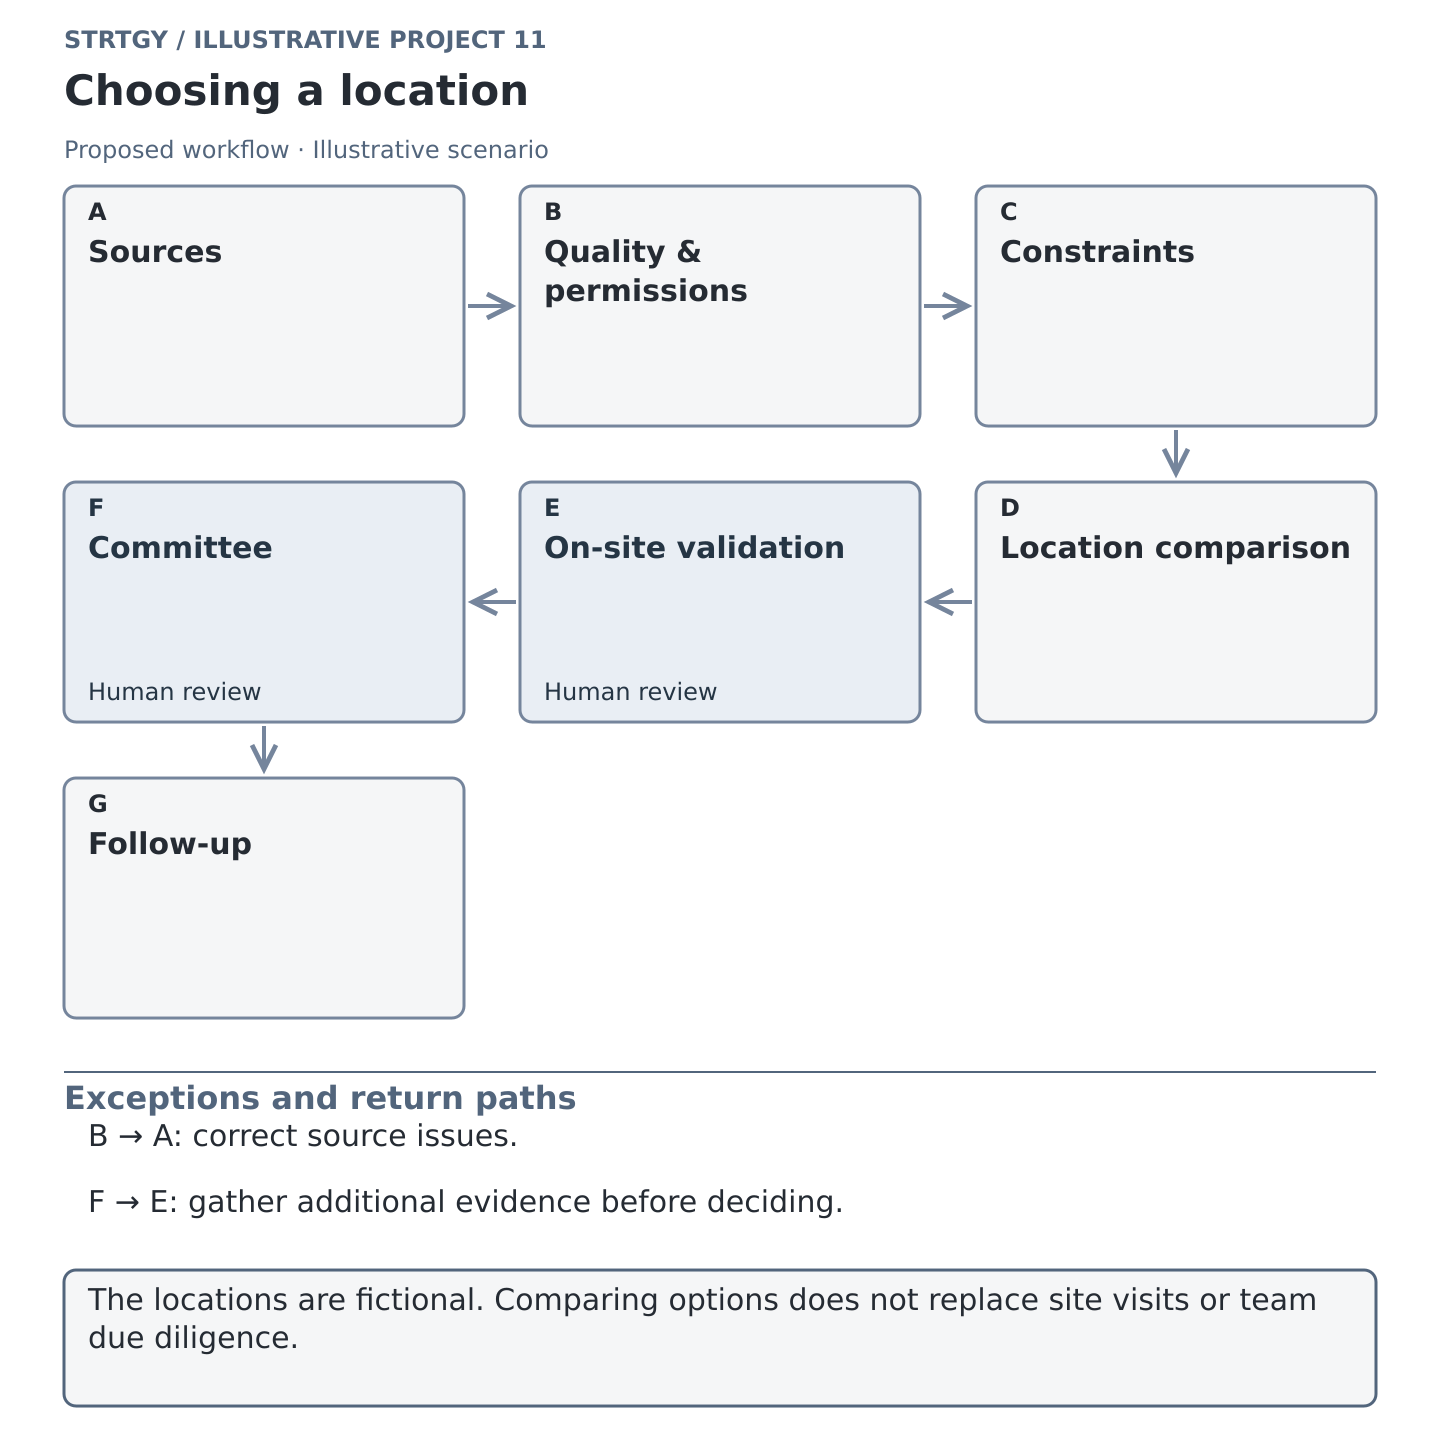
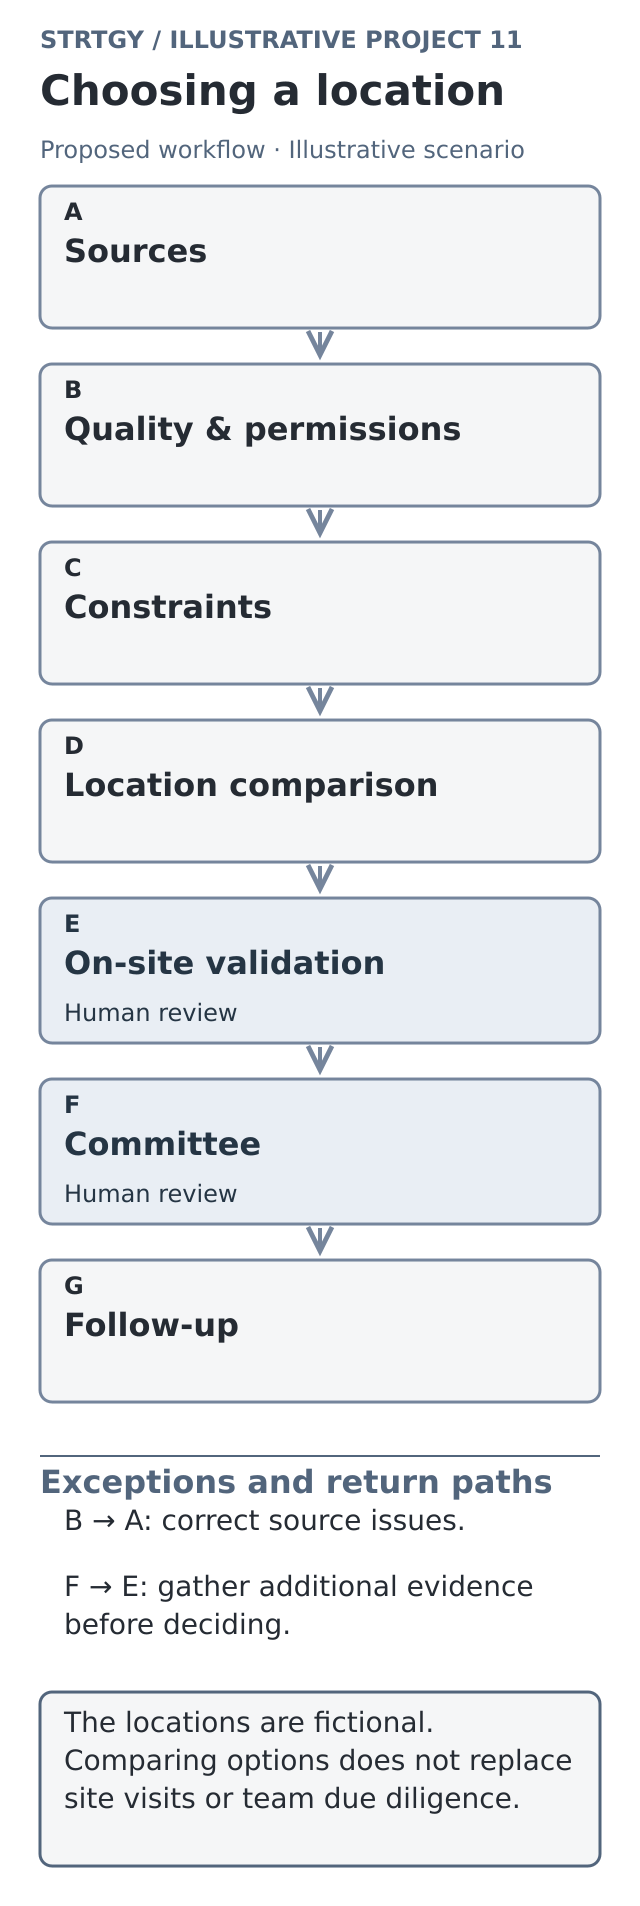
Management defines the format, budget, time horizon, and criteria that would prevent an option from moving forward.
The analyst integrates sources; the data owner reviews duplicates, reporting periods, and licenses.
Operations verifies property conditions and records exceptions that require a site visit.
The system compares coverage, observable competition, and operating capacity, distinguishing facts from estimates.
Finance reviews rent, investment, margin, and scenarios. Incomplete contractual terms block the final recommendation.
The committee compares alternatives and requests more evidence when their ranking changes too much across assumptions.
Management authorizes further study, rejection, or negotiation. The person responsible records the reasons and follow-up actions.
What the user would see
A profile for each candidate would bring together occupancy costs, constraints, available evidence, and outstanding questions. A comparison view would allow users to adjust assumptions and open the source behind each criterion. An actual map, if developed, would use verified coordinates and an authorized basemap. The illustration for this case would be purely conceptual, using areas A, B, and C without streets, scales, or simulated distances.

Illustrative on-site validation scene: reviewing access and property conditions provides evidence before advancing an expansion alternative.
Deliverables and phases
The first phase would define criteria and audit the data. The second would prepare an initial comparison and site-visit plan. The third would incorporate on-site validation and financial scenarios. Deliverables would include an alternatives matrix, source-linked candidate profiles, an assumptions register, a dashboard, and a process for updating candidate locations. A later phase, commissioned if appropriate, could review the performance of an opening that had actually been authorized.
Evaluation and financial example
A baseline would be established before the pilot: hours required to evaluate a candidate, the percentage of criteria supported by current evidence, and the number of alternatives reviewed using the same methodology. The formulas would be: evidence coverage (%) = documented criteria / applicable criteria × 100; evaluation time = recorded working hours / completed candidate evaluations. After an opening, operating contribution and sales at nearby locations would be reviewed without automatically attributing changes to the system.
Hypothetical monthly example: additional fixed costs of MXN 240,000 and a contribution of MXN 80 per transaction imply 3,000 transactions to cover those costs, equivalent to 100 per day over 30 days. If the contribution falls to MXN 65, the threshold rises to 3,693 transactions, rounded up. The calculation excludes initial investment, financing, and taxes. It does not estimate demand or promise profitability.
What do you need to verify before choosing your next location? Let's talk about your expansion.