
EXPANSION & LOCATIONS
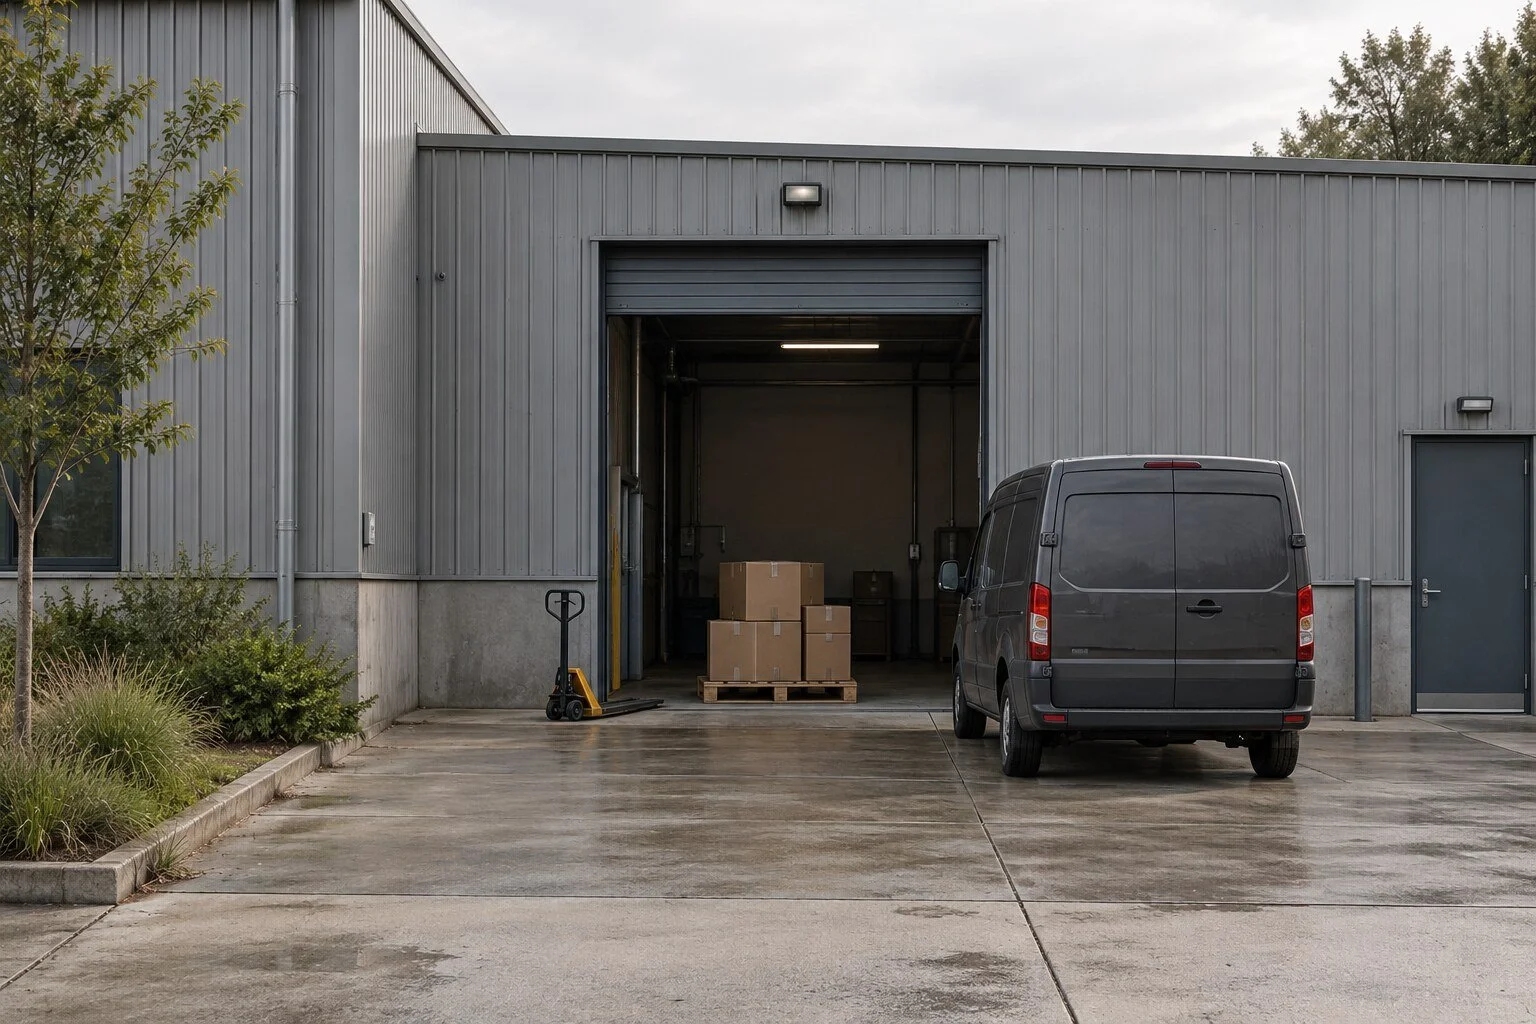
Assessing a new distribution point without duplicating coverage
Illustrative project
Illustrative scenario. The data and calculations are assumptions used to explain the application.
Application: Expansion & Locations
Business type: Distributor of industrial maintenance consumables
Context and decision
The distributor distributes industrial maintenance consumables from a central warehouse. The sales team is requesting another distribution point because of delays and lost opportunities. Operations proposes improving routes before opening a new facility. Management needs to compare three options: retain the current structure and adjust delivery frequency, contract a regional logistics provider, or set up a small company-operated warehouse.
The decision involves more than current sales. An attractive territory may generate small orders or require costly delivery arrangements. Nor does every opportunity in the CRM become demand. The challenge is to connect the market the company can serve, the service level, and the resources required using shared definitions.
Required data and sources
The project would need orders by delivery point, order lines and volume, promised and actual delivery times, route costs, returns, availability, and incidents. The CRM would provide opportunities with dates, stages, and reasons for loss. The team would remove duplicates and distinguish active customers, prospects, and businesses that appear only in a directory.
External sources could provide business locations, road connectivity, and logistics providers' commercial terms. Recency, coverage, and usage rights would be checked, particularly where a provider restricts the storage or display of derived results. A routing engine, if used, would need licenses compatible with the project. Its estimated travel times would be checked against actual operations, schedules, vehicle restrictions, and delivery windows.
Comparisons would use the same definition of an order, reporting period, and service level. Geocoded addresses would retain an accuracy indicator; an approximate address would not support a delivery promise. Only necessary, authorized business information would be used, without profiling individuals or inferring sensitive attributes. Browsing data or road traffic would not be presented as purchase intent.
Proposed solution
STRTGY could develop a territory analysis connected to an operational simulator. The solution would compare verifiable coverage, capacity, and cost to serve across the alternatives. Inventory, scheduling, load, and staffing constraints would take priority over a commercial ranking.
Scenarios would distinguish observed orders, qualified opportunities, and assumed demand. The team could change delivery frequencies, capacity, or the candidate location and review which customers could be served. Where information was insufficient, the tool would show an outstanding question rather than silently filling in an estimate.
Workflow
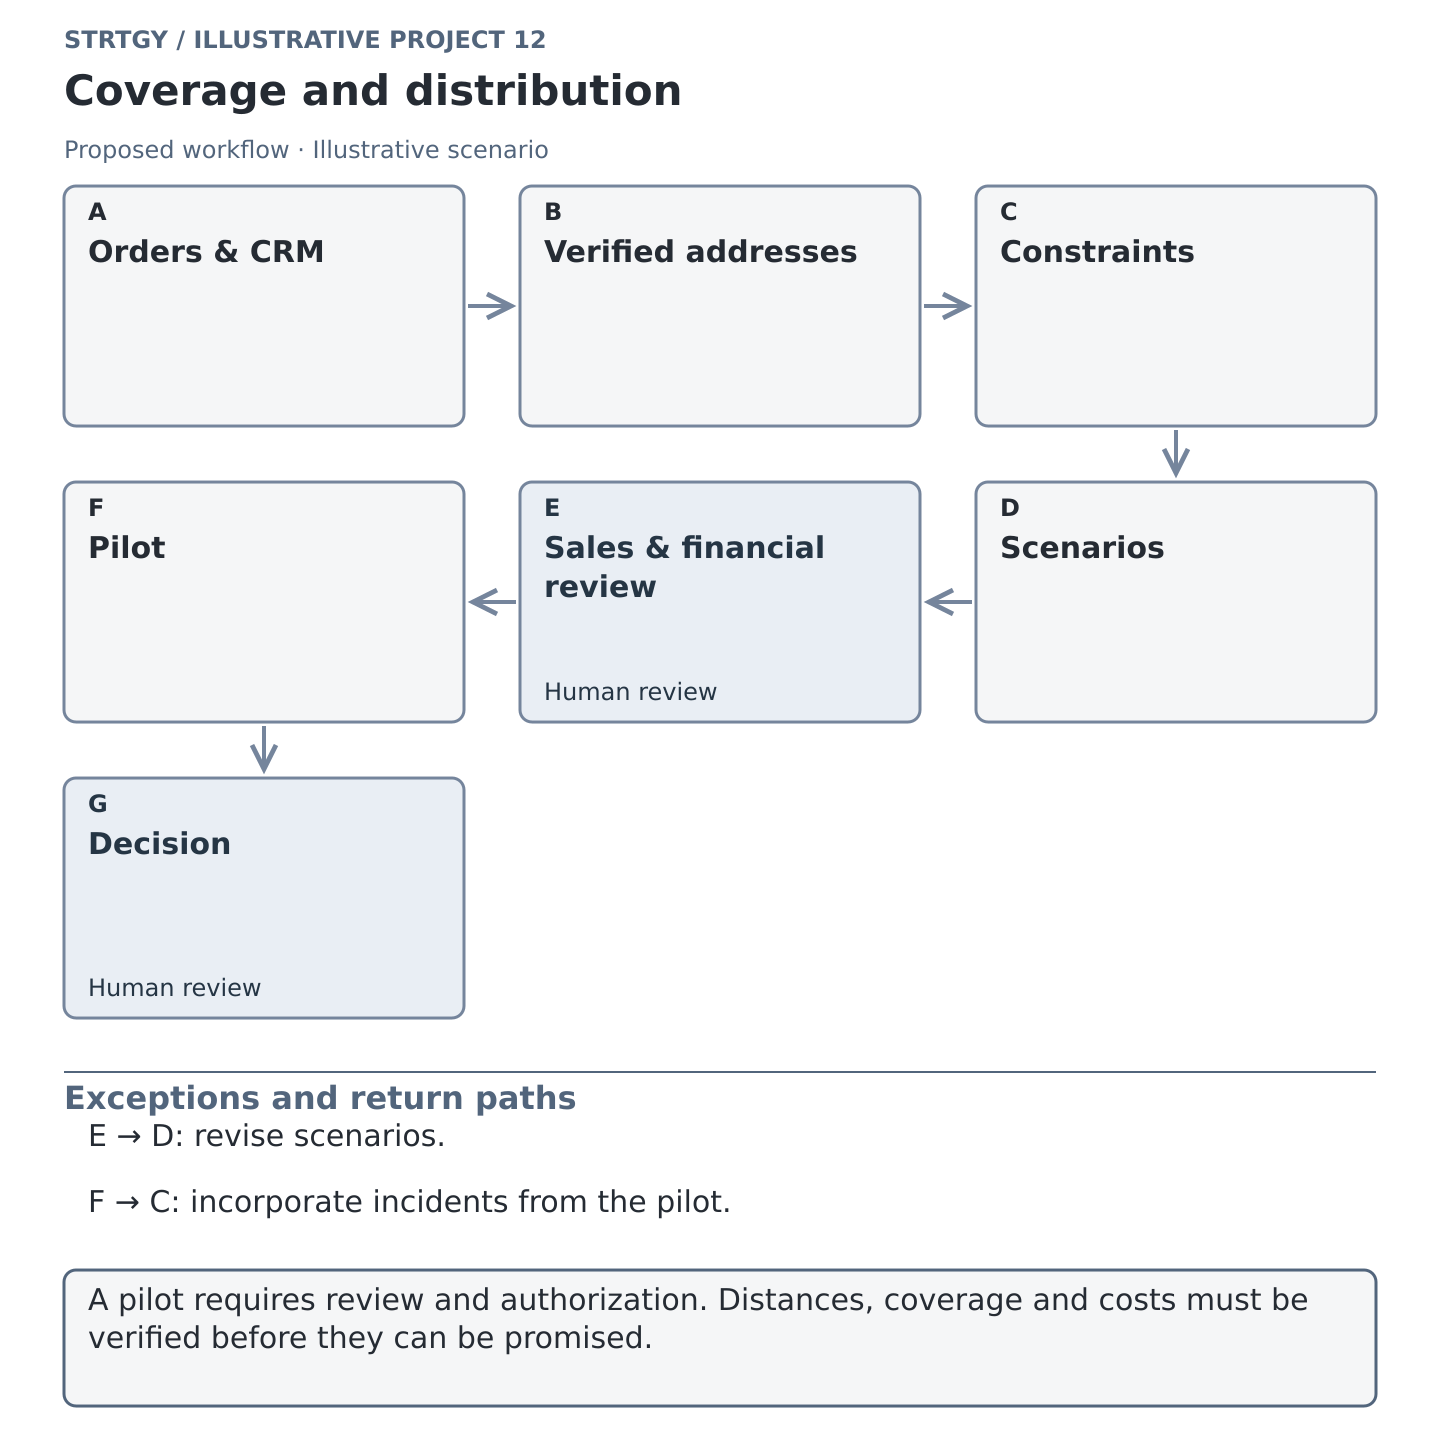
Management and operations agree on the decision, service commitments, and budget to be evaluated.
The data team integrates orders, CRM data, and routes. Ambiguous addresses go to the relevant sales owner for validation.
Operations measures effective capacity and documents constraints by product or customer.
The analyst builds comparable scenarios and tests changes in volume, cost, and frequency.
Sales reviews which opportunities meet qualification criteria. Unverified opportunities remain outside the baseline demand.
Finance reviews the provider's proposals, investment requirements, and full costs. Incomplete rates require clarification.
The committee authorizes a clearly scoped pilot or requests adjustments before committing to expansion.
Operations records the pilot results, and management decides whether to continue, modify, or stop.
User experience and deliverables
The user would see a comparison of three scenarios, with orders that could be served, capacity utilization, estimated cost, and unresolved assumptions. Users could open an area and see what changed when a constraint was added. Each decision would retain its date and author.
Deliverables would include a coverage assessment, data dictionary, scenario model, alternative profiles, pilot design, and monitoring dashboard. The website illustration would use a diagram of the warehouse, provider, and areas, clearly labeled as conceptual. A subsequent operational map would require verified locations, a suitable map projection, and calculated travel times. Diagram lines would not be presented as actual routes.
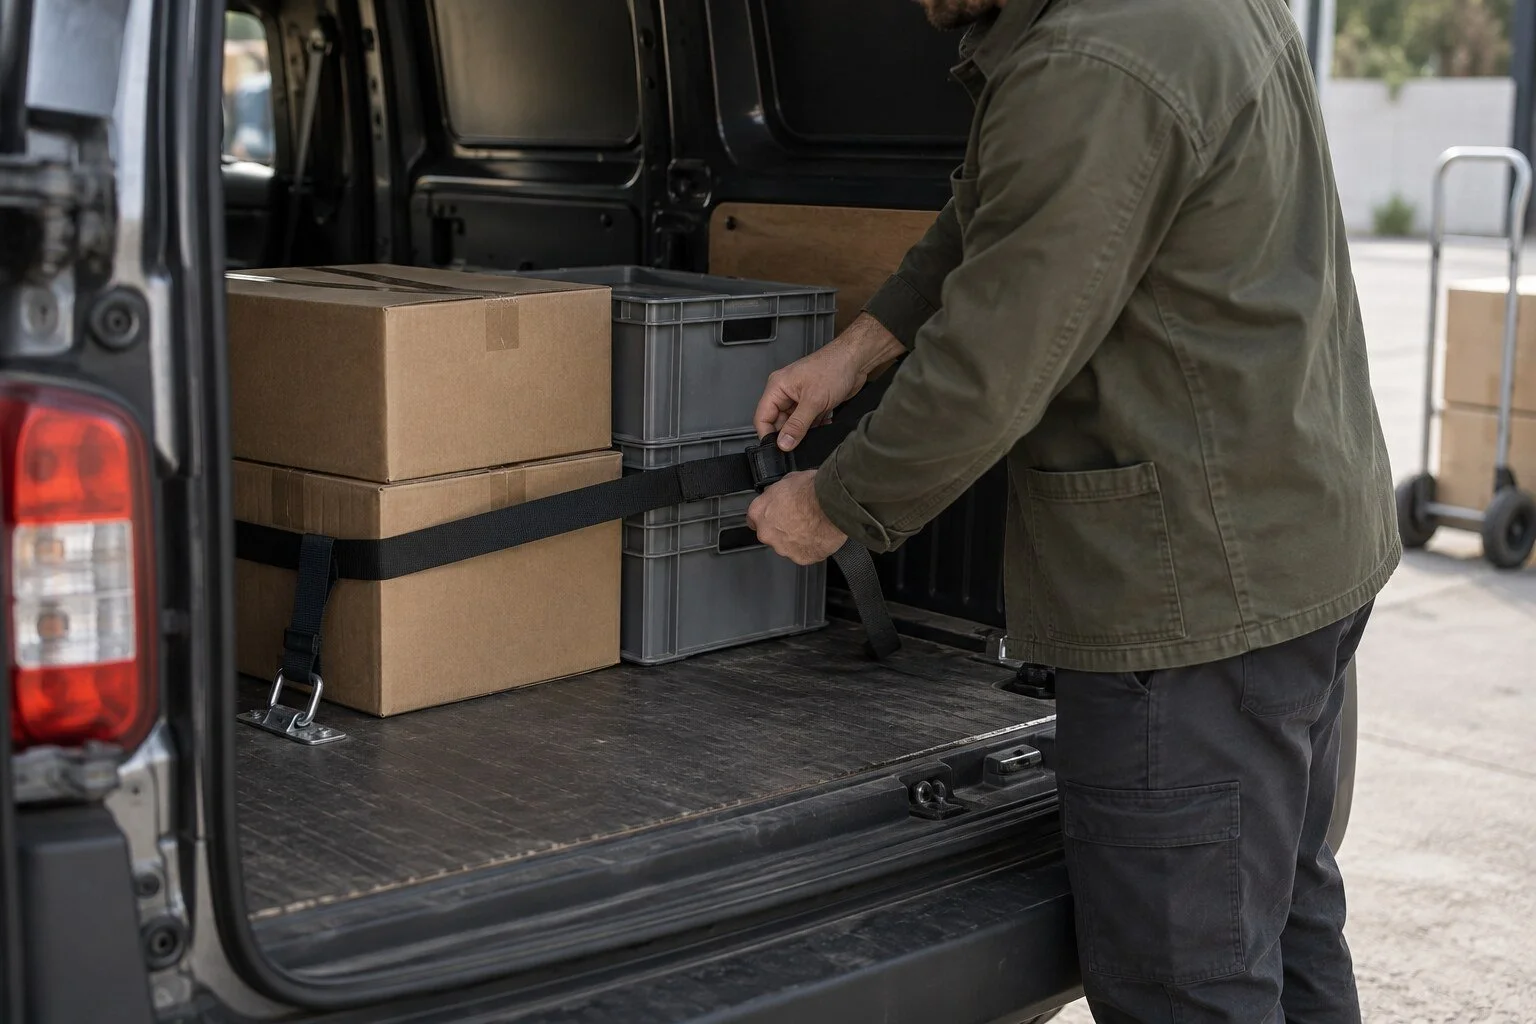
Illustrative operational review: checking the load and available space helps compare distribution scenarios against practical delivery constraints.
Phases and measurement
The project would begin with an assessment and baseline. Scenario design and validation with the relevant owners would follow. Initial implementation could take the form of a pilot defined by area and order type, with stop criteria if costs or incidents exceeded agreed thresholds. Expansion would depend on measured results and available capacity.
Metrics: on-time deliveries (%) = orders delivered within the agreed window / delivered orders × 100; cost per order = attributable service costs / orders served; operational coverage (%) = eligible destinations that can be served under the constraints / eligible destinations evaluated × 100. The baseline, time window, and exclusions would be established before the pilot. Coverage would not equate to market share.
Hypothetical example: an additional distribution point costs MXN 180,000 per month and avoids MXN 120 in costs per order relative to the comparable operating scenario. It would require 1,500 monthly orders just to offset that fixed cost. At 1,200 orders, gross savings would be MXN 144,000, leaving MXN 36,000 uncovered. The example excludes initial investment, additional inventory, and transition costs. Those items would be included before a decision was made.
Does your expansion call for another location or a better way to serve the territory? Let's review the alternatives.