
COMMERCIAL STRATEGY

Prioritizing customer segments by need and service capacity
Illustrative project
Illustrative scenario. The data and calculations are assumptions used to explain the application.
Application: Commercial Strategy
Business type: Custom cardboard packaging manufacturer
Context and decision
The manufacturer makes custom cardboard packaging and receives inquiries from businesses with different volumes, requirements, and buying cycles. Its sales team spends a similar amount of time on each opportunity, even though some require production runs the plant cannot accommodate and others need certifications the company does not yet offer. The business wants to grow without filling its pipeline with quotes it is unlikely to be able to fulfill.
The decision is to choose two segments for a sales pilot and define an appropriate offer for each. Management also needs to know which segments to keep under observation. A large industry may be difficult to serve if its technical requirements, credit terms, or coverage needs exceed the company's current capabilities.
Information and comparison criteria
The project would use quotes, orders, margins, setup times, reasons for loss, and available capacity. Sales and operations would define a qualified opportunity: a confirmed need, specifications the company can meet, a compatible volume, and an agreed next step. CRM stages would be reviewed so that an outdated label does not determine priority.
External sources could include business directories, industry statistics, public catalogs, and buyer interviews conducted with consent. Coverage, dates, licenses, and permission to use the information in the deliverable would be checked. Finding contact databases or third-party materials online would not be treated as permission to copy or reproduce them.
Competitors' offers would be compared by specification, minimum volume, customization, delivery, and observable terms. A published price for a different quantity or material would not be an equivalent benchmark. Missing data would remain clearly identified. Industry size would not be presented as the market the company could win, and page visits or reviews would not substitute for orders. The analysis would focus on stated business needs and authorized commercial data, without inferring individuals' sensitive traits.
Proposed solution
STRTGY could develop a segment attractiveness and feasibility matrix connected to sales and operational evidence. Attractiveness would bring together observed problems, recurring needs, and purchasing terms. Feasibility would consider capacity, margin, technical requirements, and the effort needed to serve each segment. Weights and thresholds would be visible and open to revision.
The solution would propose hypotheses to test: which need to address, which configuration to offer, which argument the evidence supports, and which signals would justify proceeding. The system could prepare profiles and gather background information, while the relevant owners would validate positioning, prices, and offered terms. It would not send campaigns or commit capacity on its own.
Operational workflow
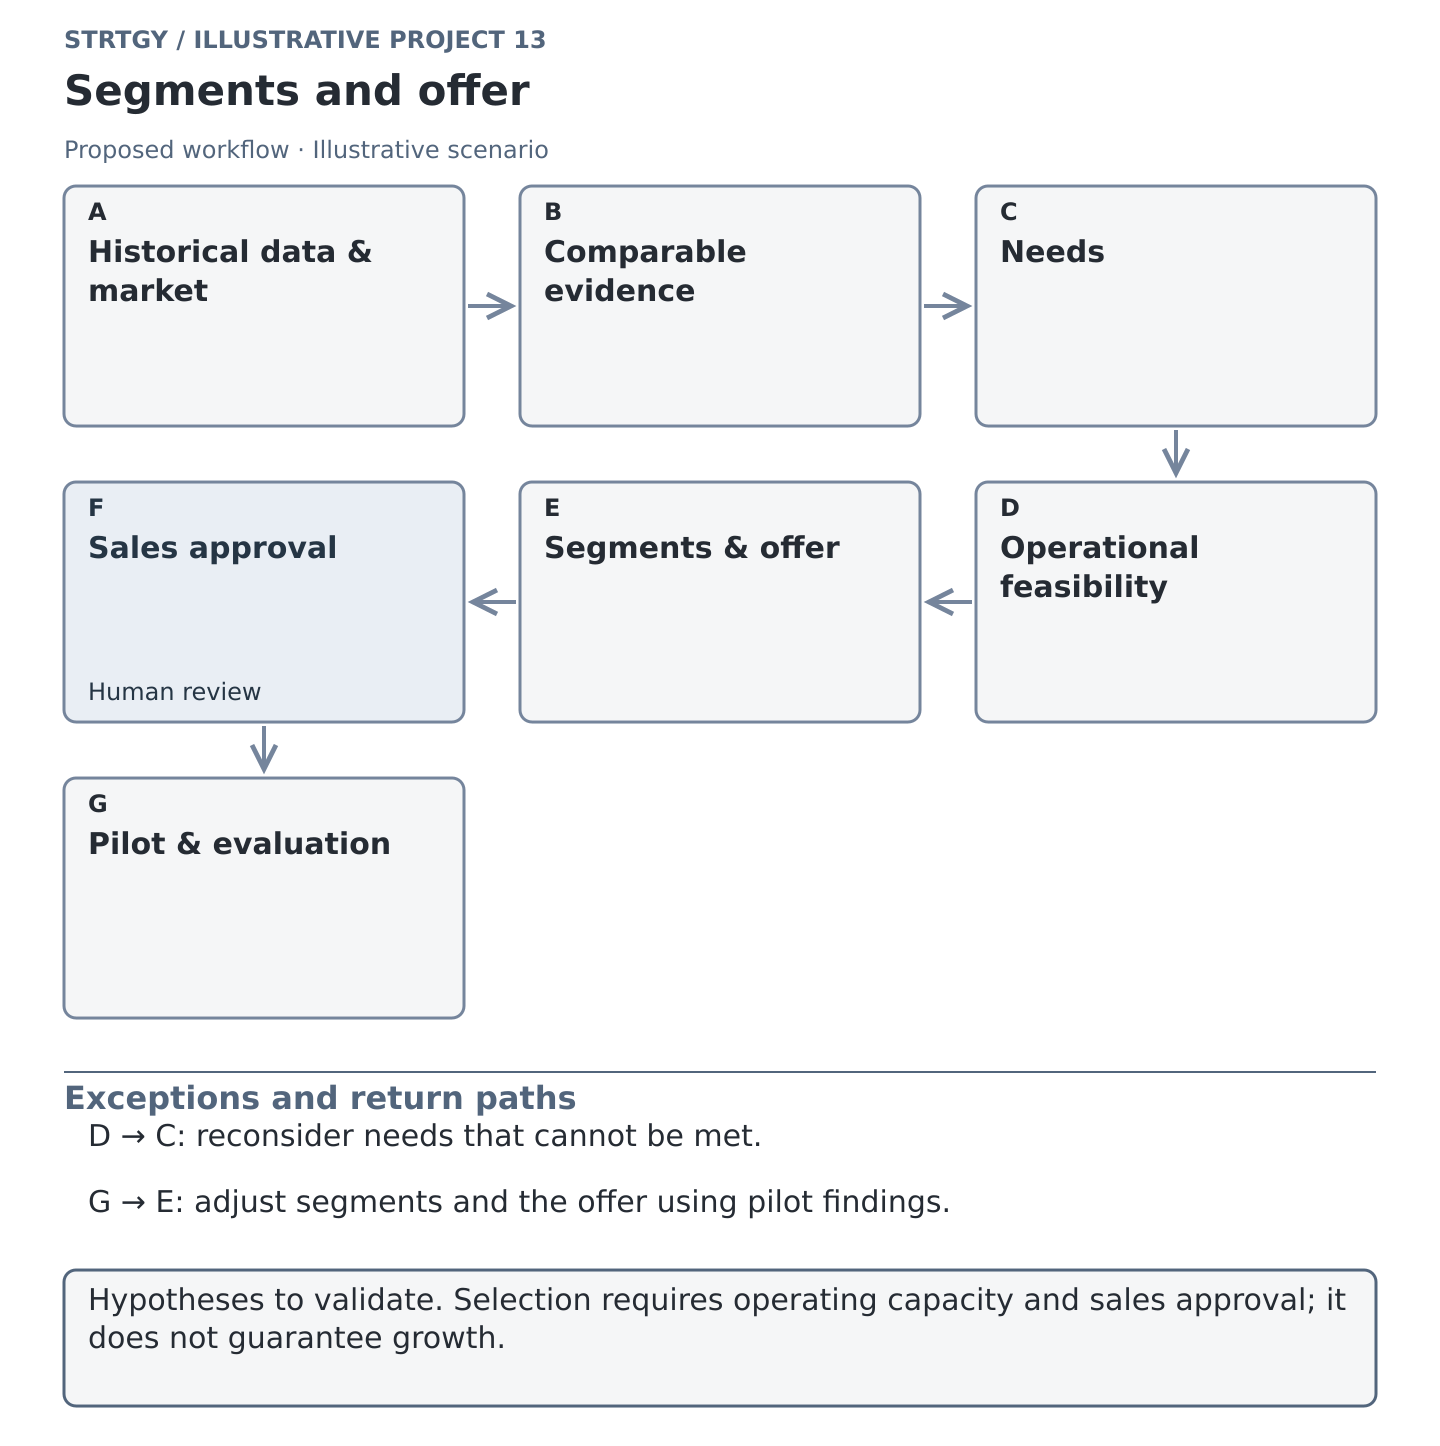
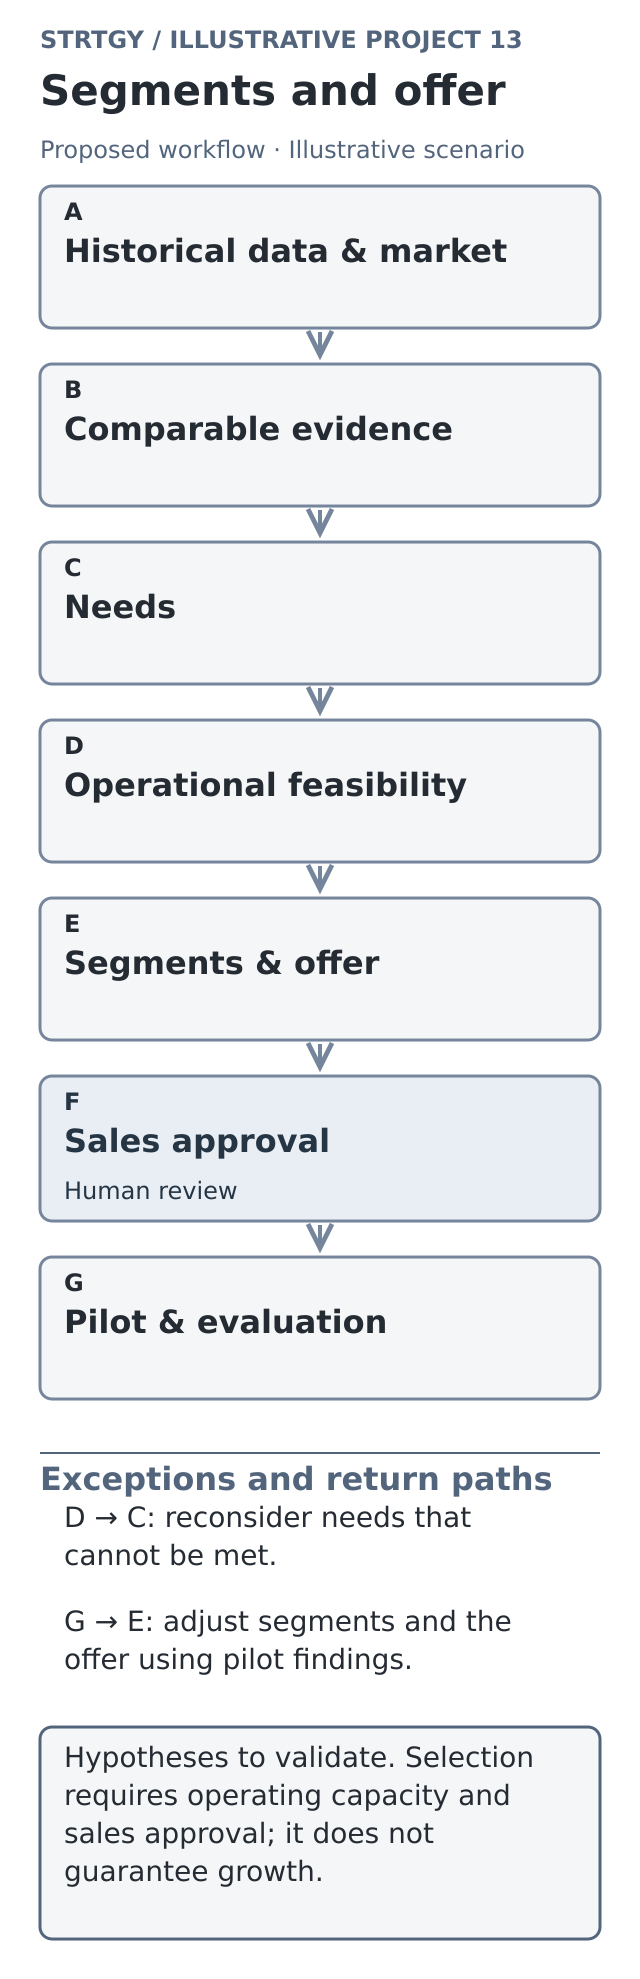
Management defines objectives, constraints, and candidate segments with sales and operations.
The analyst integrates historical data and sources. The data team reviews definitions, usage rights, and duplicates.
Sales confirms buying motives and reasons for loss through evidence or interviews, separating observations from hypotheses.
Operations validates requirements, production runs, and capacity. A missing certification rules out the corresponding offer.
The tool compares segments and prepares profiles with evidence, uncertainty, and outstanding questions.
Sales leadership approves two hypotheses, the materials, and qualification criteria for a limited pilot.
The team runs the pilot through authorized channels, recording opportunities and objections without changing definitions midway through measurement.
Sales and finance review the results and decide whether to expand, adjust, or stop each proposal.
What the user would see
A segment view would show attractiveness, feasibility, missing information, and reasons for inclusion. Each profile would let the user trace the link between the need, evidence, suggested offer, and test still to be run. Another view would separate opportunities generated, qualified, quoted, and won, using comparable cohorts and follow-up dates.
Deliverables would include the segment matrix, competitive analysis, offer profiles, qualification criteria, pilot design, and dashboard. The project would move from diagnosis and audit to focused research, proposal design, and sales validation. The scope would define ownership and how sources would be maintained.

Illustrative materials and capacity review: validating production specifications helps distinguish which packaging needs the operation can serve before prioritizing segments.
Evaluation and hypothetical financial example
A baseline would be established by segment and cohort before the pilot. Metrics: qualification rate (%) = opportunities meeting the criteria / opportunities reviewed × 100; conversion (%) = won qualified opportunities with completed buying cycles / qualified opportunities with completed buying cycles × 100; contribution per order = net revenue minus attributable variable costs; sales effort = recorded hours / qualified opportunities. Opportunities still open would not be counted as losses or mixed with completed cycles.
Assume a pilot costs MXN 60,000 and contributes MXN 12,000 per first order. Five incremental orders would be needed to cover that outlay. If four were secured, they would contribute MXN 48,000, leaving MXN 12,000 to recover. This is illustrative arithmetic, not a sales expectation. Measurement would need to verify incrementality and account for omitted costs. Future repeat purchases would not be included as guaranteed revenue.
Which customers can your business serve best, and with what offer? Let's talk about your commercial strategy.