INVENTORY AND PURCHASING

Español | English
Home · What We Do · Applications · Insights · Contact
Replenish one location with a view of inventory across the network
Illustrative project
Illustrative scenario. The data and calculations are assumptions used to explain the application.
Application: Inventory and purchasing
Business type: Home goods chain with a distribution center and several stores
Shortages and excess stock in the same network
In this scenario, one store urgently requests goods while another accumulates units of the same product. Purchasing reviews historical sales, the warehouse knows the stock position, and store managers remember local promotions that have not yet appeared in reports. The conversation repeats whenever replenishment needs to be decided.
Buying more can increase excess inventory. Transferring stock may make sense, but it can also create a shortage at the origin or incur disproportionate transport costs. The decision is to compare, for each product and location, whether to replenish from the distribution center, transfer between stores, review a purchase, or wait with an explicit rationale.
Data that needs to be connected
The project would require sales by date and location, usable inventory, reservations, in-transit movements, open orders, lead times, pack sizes, and logistics costs. Promotions, discontinued products, and capacity constraints would also matter. Negative inventory and differences between physical counts and system records would be flagged as data-quality issues rather than interpreted as actual demand.
The solution would consolidate a network snapshot and calculate stock coverage under agreed scenarios. It could combine replenishment rules with a demand estimate, whose usefulness would need to be validated against simpler methods. Sales observed during stockouts do not capture all demand, so periods with stock available would be distinguished from periods in which observed sales are constrained by shortages.
Recommendations would show constraints, the costs considered, and risks. They would not be executed orders. Writing to the ERP or warehouse system would depend on connectors, permissions, and testing. If data were updated only daily, the view would state that frequency and require stock to be reconfirmed before a transfer.
From a signal to a recorded decision
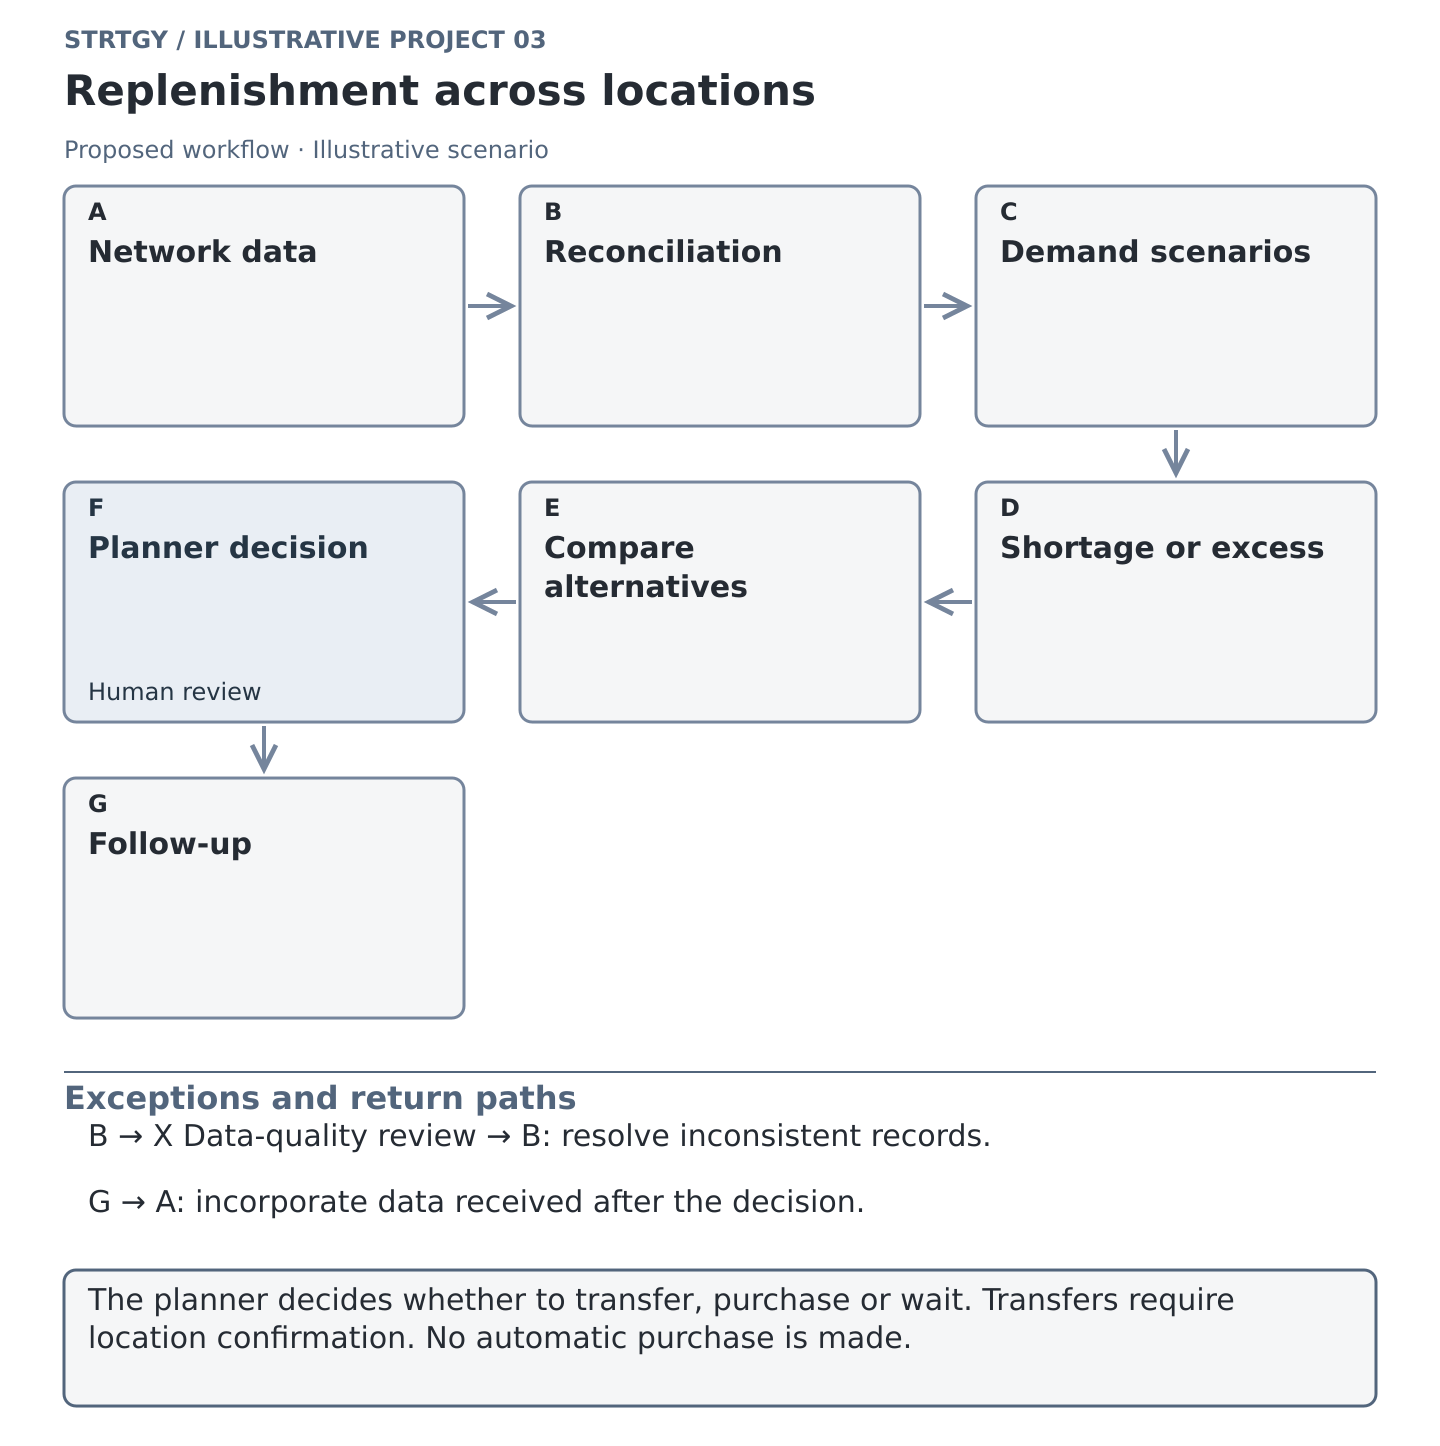
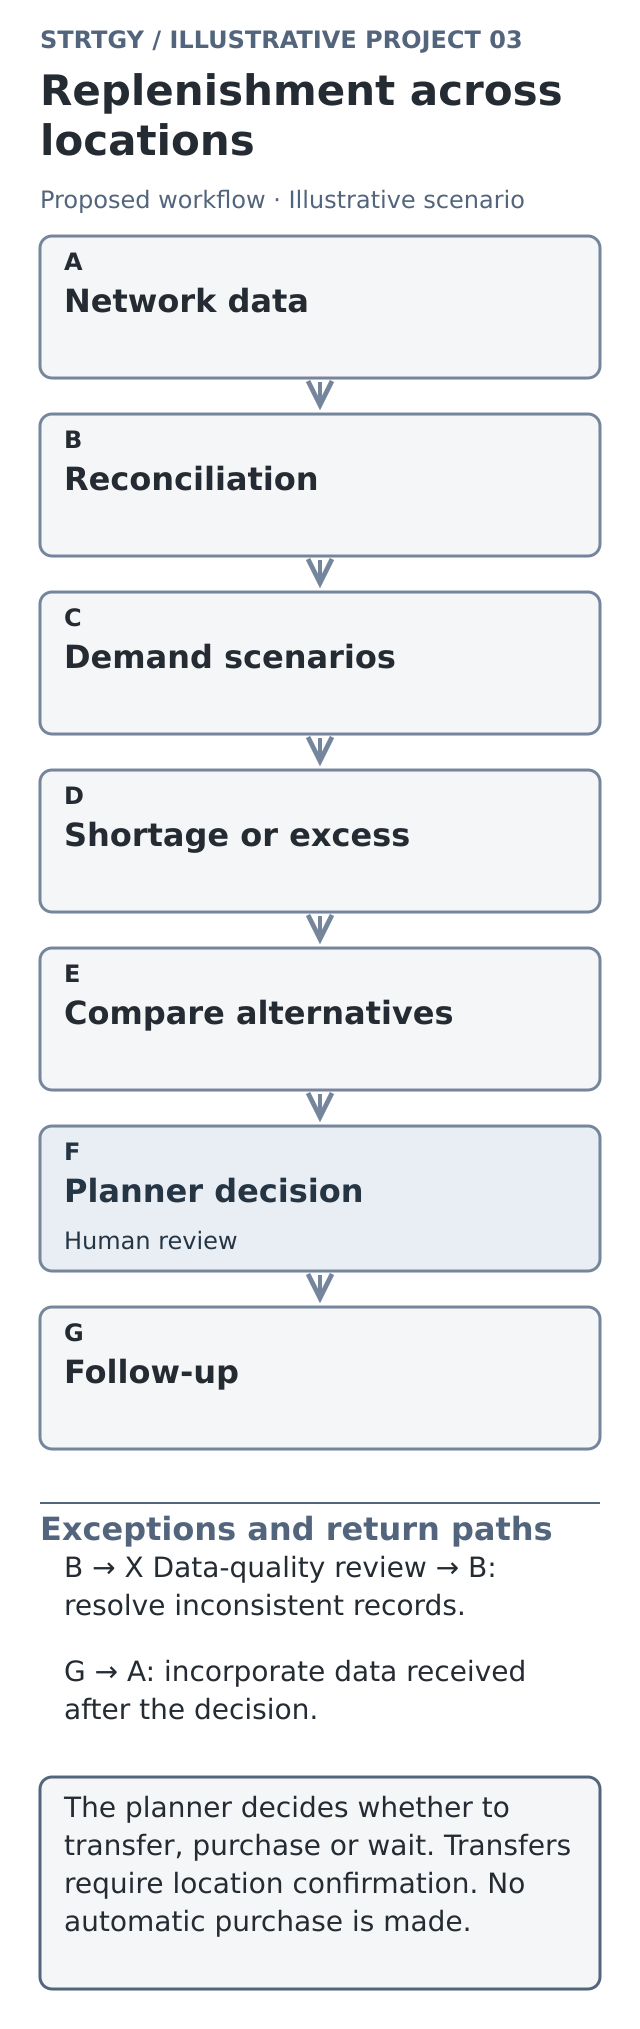
Reconcile. Codes, units, and locations are linked. Inconsistent records are excluded from recommendations until reviewed.
Establish the stock position. Usable inventory is calculated after deducting reservations and separating damaged or blocked goods.
Estimate. Consumption is projected under scenarios that incorporate authorized promotions. New products and products with insufficient history receive specific treatment.
Detect. Shortage and excess risks are flagged using category-specific thresholds rather than one rule for the entire catalog.
Compare. The workflow presents replenishment, transfer, or purchase-review options, accounting for lead time, pack size, and movement costs.
Decide. The planner reviews alternatives and records the reasons for adjustments. Transfers require confirmation of capacity and availability with the locations involved.
Follow up. The decision and its operational outcome are recorded. An authorized integration could prepare the order; errors or changes in availability return to review.
A shared view for inventory planning
The team would see a prioritized list by product and location, with estimated coverage, units in transit, and the reason for each signal. Opening a recommendation would show what happens if stock is transferred, purchased, or left unchanged. Figures would include update dates and visible assumptions. The planner could correct an omitted promotion while keeping the intervention visible.
Deliverables would include an inventory and demand model, agreed rules, an exception view, decision scenarios, and a follow-up log. Work would begin by reconciling one category and establishing the baseline. Recommendations would then be compared with historical decisions, followed by a supervised pilot. Expansion to more categories or integrated actions would follow only after evaluating limitations. No universal improvement or timetable independent of data quality would be promised.

How usefulness would be tested
The baseline must be defined before the pilot, using the same locations and products over comparable periods:
Availability: product-location observations with usable inventory greater than zero divided by active observations × 100. This measures recorded availability, not shelf availability directly.
Excess inventory: the sum of units above the agreed threshold × unit cost, avoiding aggregation of categories with incompatible rules.
Analysis time: active minutes required to prepare and review a replenishment cycle.
Execution: approved recommendations executed within the agreed period divided by approved recommendations × 100.
Evaluation would also consider transfer costs and subsequent shortages at the origin. Moving excess inventory from one store to another would not count as a network improvement.
An economic scenario that distinguishes cash from savings
Assume an analysis identifies 200,000 MXN in potentially avoidable inventory, with an approved annual carrying-cost rate of 18% for the exercise. If the reduction were sustained for a full year, estimated annual cost avoided would be 200,000 × 0.18 = 36,000 MXN. The 200,000 MXN would represent capital that could be released, not additional profit. If the necessary transfers hypothetically cost 12,000 MXN during that same year, the remaining amount would be 24,000 MXN in the year evaluated, before solution costs. The business would need to validate demand, persistence of the effect, and the components of carrying cost; not all of those components translate into realized savings.
Do shortages and excess stock occur at the same time? Let’s review a category and the decisions currently involved in moving it between locations.